
The status meeting, made unnecessary
Most reporting is somebody exporting a spreadsheet on a Thursday. Here the dashboard is a view of the rows people are already working in, and the history underneath it is kept without anyone maintaining it.
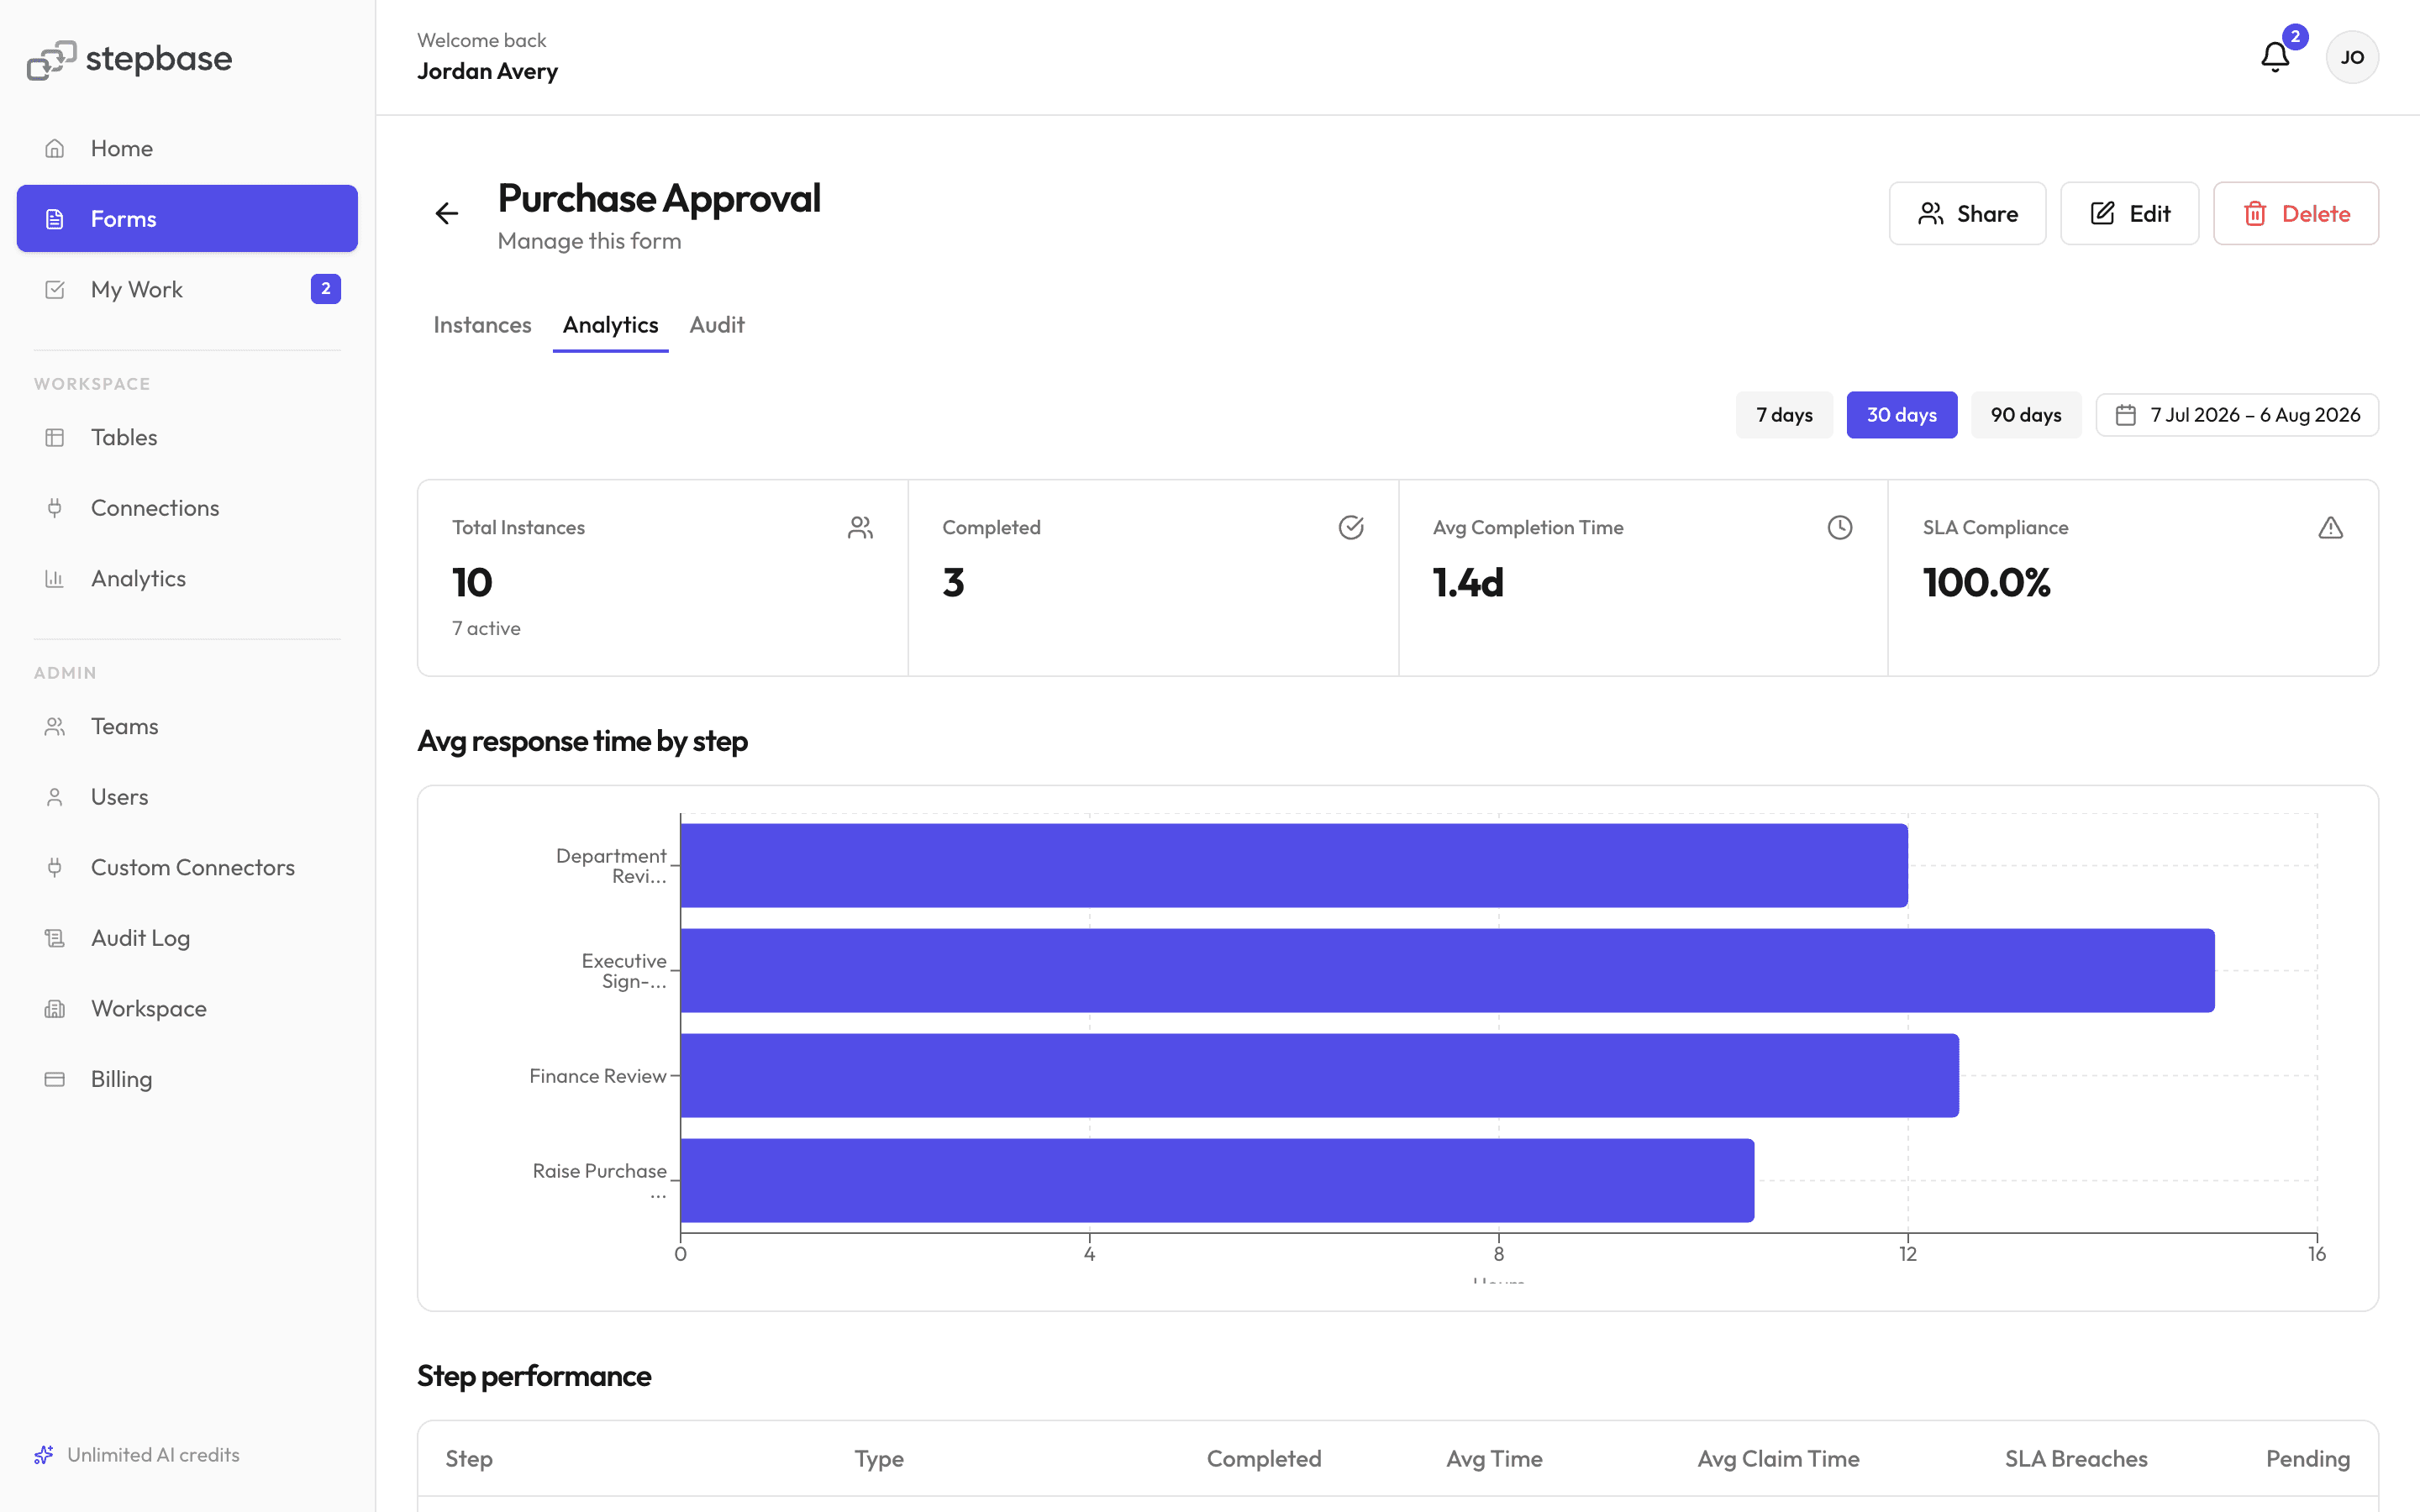
- Tiles and charts on live rows
- Count, sum, average, min or max, filtered however you like. Group by a column or bucket by a date grain — day, week, month, quarter or year.
- Where work piles up
- Cycle time per Step, completion rates, and the stage things sit at longest. The bottleneck is a number rather than a feeling.
- A complete audit trail
- Every action recorded: who did it, when, and the state of the record at the time. AI-driven steps are in there too, with their confidence and reasoning.
- Who actually did it
- A task assigned to a team records the person who claimed and completed it, not just the queue it went to — which is the difference between a report you can act on and one you cannot.
Templates that use it
- AppPurchasingPurchase requisitions routed by spend threshold through department, finance and executive approval, then tracked as purchase orders against a register of approved vendors.
- AppAsset RegisterEvery laptop, monitor and desk the company owns: who has it, where it is, and what it has cost since.
What it does not do
- A tile groups exactly one way — by a column, or by a date bucket. Both at once is a pivot table, and a pivot table is not a tile.
- Audit export is a paid-plan feature.